Heatmap Reports
Once a heatmap starts collecting data, “View Report” will available within 10-15 minutes from dashboard. TruConversion heatmap will open at your live website in a separate browser window. This report shows tracking for the measure you have defined for the heatmap.
The New Heatmap Reporting appears like this:
After loading your website the following options are available:
By default click map with Desktop device is selected:
- Available Maps: User can also switch between Move, Scroll and detailed report.
- Choose Devices: User have options to choose any device between Desktop, Tablet and Mobile from bottom right corner.
- Filtration: User can filter reporting by date, Source of visitor, Campaigns, Operating system, Browsers and Country.
- Background Intensity: Set Background intensity for better data visualization.
- Download Heatmap: User can download heatmap report as an image. Just click on the download button from bottom right corner and the selected heatmap will be download as an image.
- Share Heatmap: TruConversion let u share heatmap report with others. Find the shareable link by clicking share icon from bottom right corner and email this link or directly past into browser. Don’t forget to switch on the toggle for sharing.
- Compare Heatmap: Now user can compare heatmap report with other heatmaps available in his account by clicking the compare icon from bottom right corner and choose the heatmap.
- Navigate: Do you have pop ups on your page that block key heatmap data? Well, now you can temporarily turn off your heatmap during analysis to close out your pops, chat windows, or other interstitial marketing tools using the ‘Navigate’ button in the toolbar.
Let us see these options individually:
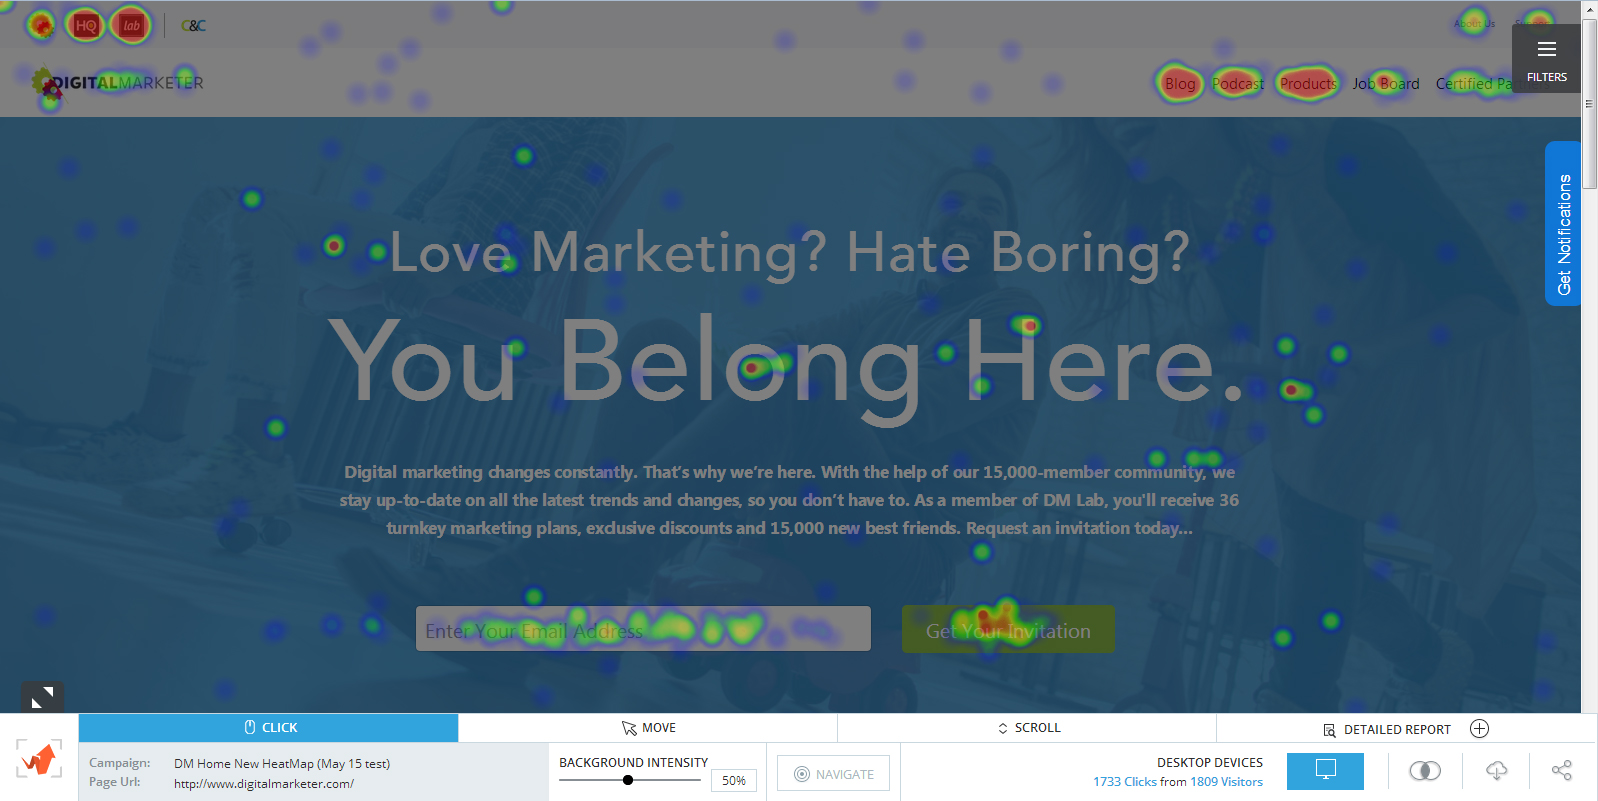
1. Click Map
TruConversion tracks user clicks/taps (For Tablet & Mobile) and generates a visual representation of the areas your visitors clicked or tapped on.
Red areas that have been clicked on most frequently while blue shows the areas that have been clicked on the least. Any area on the heatmaps which contains no colors is an area which has never been clicked on.
2. Move Map
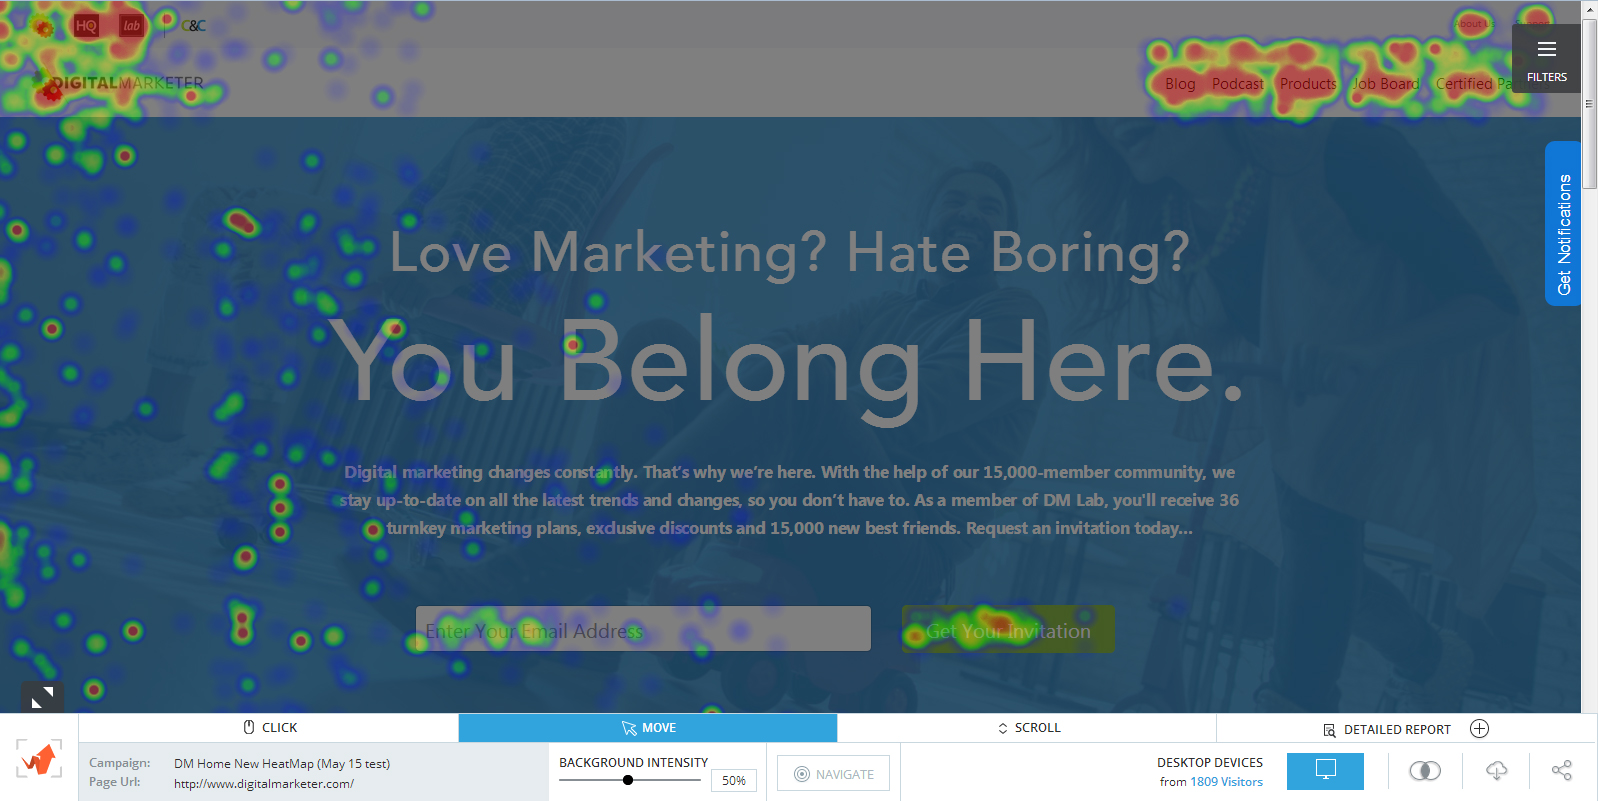
TruConversion tracks mouse movement of all visitors visiting the page the heatmap report is set for, and automatically generates a visual representation of the areas the visitors moved their mouse over. A simple color intensity is used to show density of mouse movements. If many of your visitors moved their mouse to a specific point, that area is red.
3. Scroll Map

TruConversion tracks how far each of your visitors being tracked by the heatmap scrolled down while browsing your page. The density of visitors, and the frequency with which they visited any part of the page are showed with the help of a color intensity.
TruConversion also tracks all the taps the mobile user makes on the page. The density of visitors, and the frequency with which they visited any part of the page are showed with the help of a color intensity.
4. Detailed Report

This report show precise dots of visitor clicks with detailed information on mouse hover. User can also separate visitor traffic by choosing any option from User segmentation.
Click on Dot:
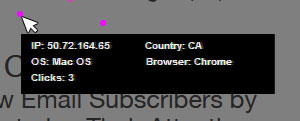
By hovering the dots, it will show you details of the dots:
- IP address: The Ip address of the visitor.
- Operating system: The Operating system of the visitor.
- Country: The Country of the visitor.
- Browser: The Browser of the visitor.
Segmentation
By clicking the Plus icon next to ‘Detailed Report’. This will open a panel for selection the following segmentation with count and percentages:
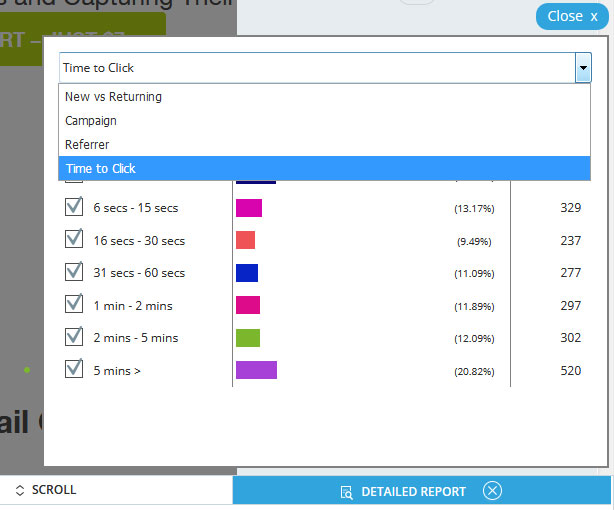
- New vs Returning: How many visitor are new vs Returning.
- Campaign: Which UTM parameter is used by visitor.
- Referrer: Check the referrer of the visitor.
- Time to click: How much time took to click this dot after landing on the page.
By clicking the checkboxes on this panel the information will appear/disappear on the page.
5. Choose device for reporting
TruConversion offers an in-built support for responsive designs. This allows the site to change automatically as the browser increases or decreases in size. TruConversion is capable of tracking visitors according to the elements of the page.
The heatmaps generated by TruConversion will include reports from three different devices mainly:
- Desktops
- Tablets
- Phones
This is particularly helpful for websites with a responsive design.
Heatmap Reporting on Mozilla Firefox Browser:
If you using Mozilla Firefox browser for viewing heatmap reporting and your heatmap have too much data to display then FireFox will take time to load data so for making better experience TruConversion shows this message on your reporting:

This is clear that the data handling of FireFox is much less than Chrome with default configuration. This is a way to increase process time in FireFox by increasing the value to 100 of dom.max_script_run_time. This is found from Mozilla support article at below url with details how to increase this value.
https://support.mozilla.org/en-US/kb/warning-unresponsive-script
Please enhance this value to have better experience. Hope this will help keep using Firefox with large data-set reports.
Note:
- FireFox: Change this setting is for once and only for Firefox users.