Funnel Analytics Report
Once you click on a Funnel in the Funnel Dashboard you will lead to the Funnel Report.
You can view the report in the funnel of a line and graph chart:

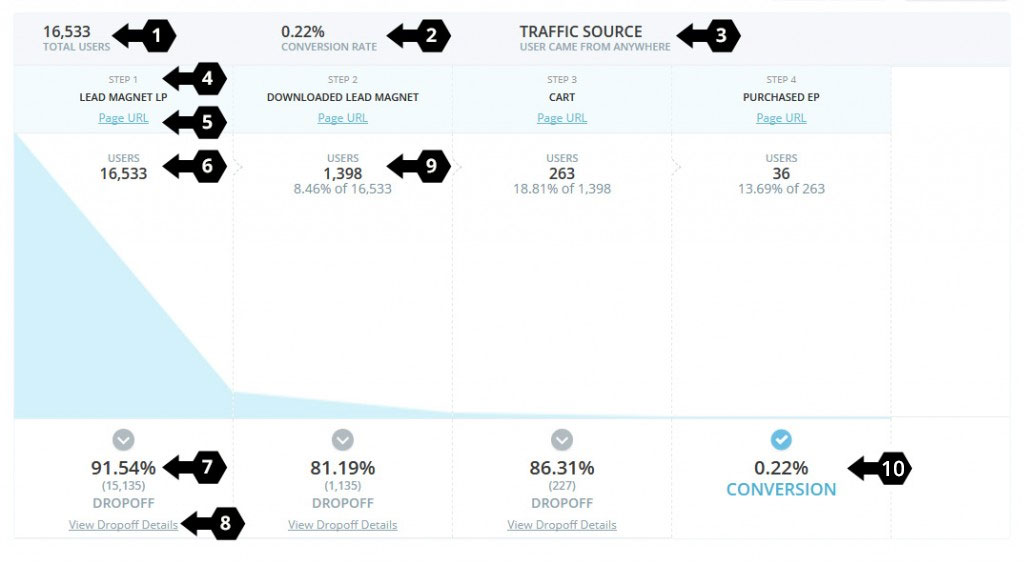
In above reports you can view:
- Total Users: Number of users who started the funnel.
- Conversion Rate: Final conversion rate of the funnel ((Number of users at final step /Number of users at first step)* 100)
- Traffic Source: From where the users are coming in the funnel
- Steps Name: Number of steps with name
- Steps Page URL: Click on Page URL to view how many pages are entered in each step.
- Users: Number of users arrived at this step
- Dropoff Percentage: Number and Percentage of users who did not move on to the desired next step in the funnel.((Number of visitor arrived at step/Number of visitor dropoff)*100)
- View Dropoff Details: By clicking this link under each Dropoff, a popup will show you the URLs where visitor gone after leaving your funnel.
- Users At Next Step: Number and Percentage of users who arrived at this step from previous step.
- Final Conversion Rate: Final conversion rate of the funnel ((Number of users at final step /Number of users at first step)* 100)
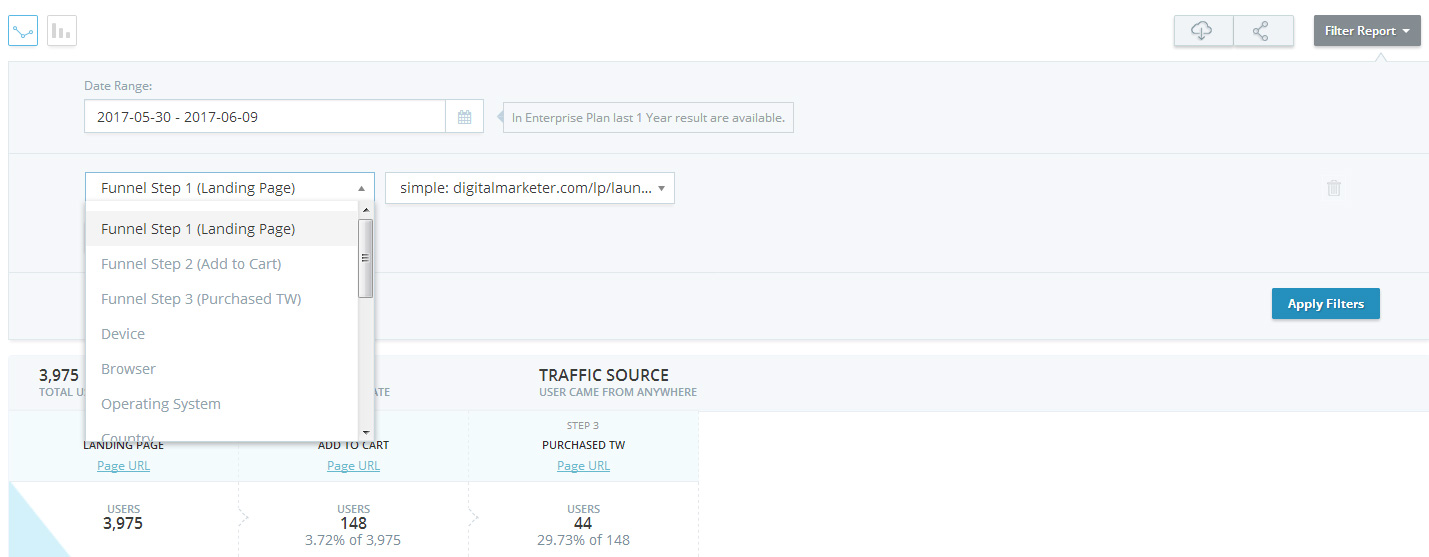
Filter Report
The report can be filtered by clicking on the Filter Report button. There are multiple filtration preset available. Now if you have given multiple URL in each step then you can filter each step with URL. Choose steps and select URL on which you want to see report.

Download & Share Report
- Download: By clicking download, once ready an email will be send to the user for download CSV.
- Share Report: By clicking share report, you will be given a link which you can share with anyone.

The results can be filtered by steps URL, date range, browser, OS, country, device, screen size and keywords.
Here is a video for sharing article::
How To Share A Funnel Analytics Report