Basic Analytics
TruConversion shows you basic analytics for your each selected domain. This gives you a fair idea about your online traffic. This allow users to select last two months (Complete) Basic Analytics data. 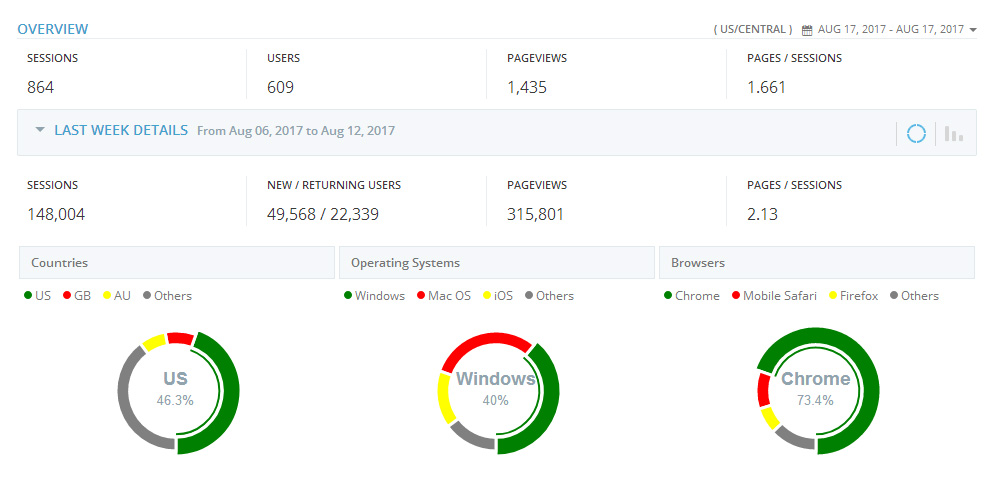
By default donuts graph is selected but you can switch anytime between donuts and Bar graph to view the graphical details.
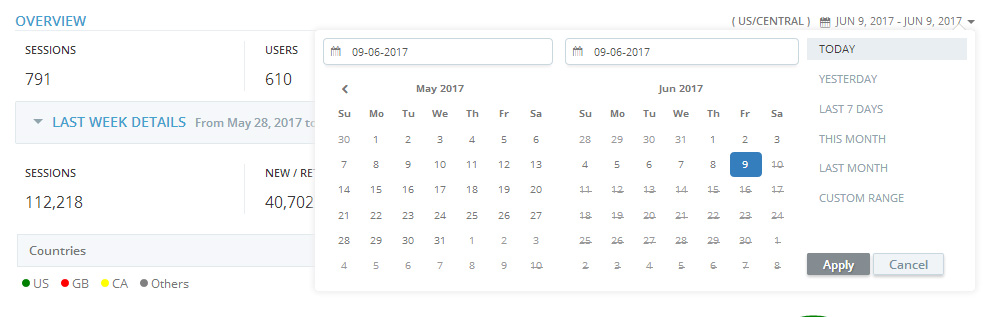
Date Filter:You can choose from preset date filters, Today, Yesterday, Last seven (7) days, This Month, Last Month and custom date range.
Note: Under the custom data range, user can select data from last 2 months (Complete) after the domain is verified.
Following are Basic Analytics TruConversion show at dashbaord
- Sessions: the number of times visitors are actively engaged on your website. Generally speaking, every visitor has at least one “session” when they visit your site, but they could have multiple sessions. We calculate session with following rules:
- Visitor has closed the browser and reopen and load the page
- Visitor was inactive for 30 minutes and then refresh the page or load a new page
- Users: the number of unique visitors that have at least one session on your website. This number is more accurate in telling you how many “individual” people visited your website.
- Pageviews: the total number of pages visited by all visitors on your website. Assuming you have multiple pages on your website, you’ll want this number to be higher than the number of sessions.
- Pages per Session: the average number of pages viewed during a session on your website. More pages per session mean that users are more engaged and exploring more of your site.
Note:
There might be slight difference between Google Analytics and TruConversion, due to the fact the calculations rules, bounce rate and IP exclusions defined on either side. Read More
There might be slight difference between Google Analytics and TruConversion, due to the fact the calculations rules, bounce rate and IP exclusions defined on either side. Read More