How to read Trend Report and How does it works?
Trend report is a revolutionary feature from TruConversion. With trend report, you can see valuable insight from your visitors at your site.
This feature enables you to see most common trends from visitor. This feature saves your hours of work. Otherwise, you need to watch hundred’s of recording to find valuable insight.
This report is based on the recorded data available in your campaign. So its better to request this trend report when you have sufficient recordings
in your campaign.
How to Request Trend Report?
Trend report button is available with every campaign at recordings page. When a user request this report first time, it analyse all of campaign recordings and get most common trend and make it ready for the user, it takes a little time but once its ready it will available for View Trend Report. Every time you need to required
- Click at “View Recordings” from your Recordings dashboard.
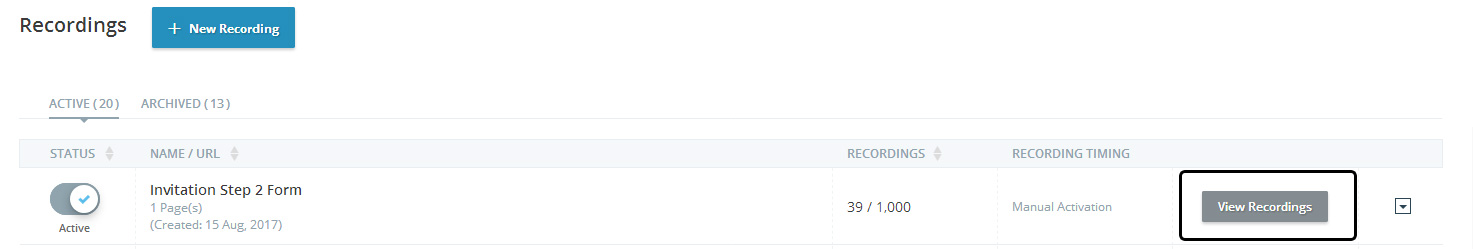
- First time this button is label with “Request Trend Report”.
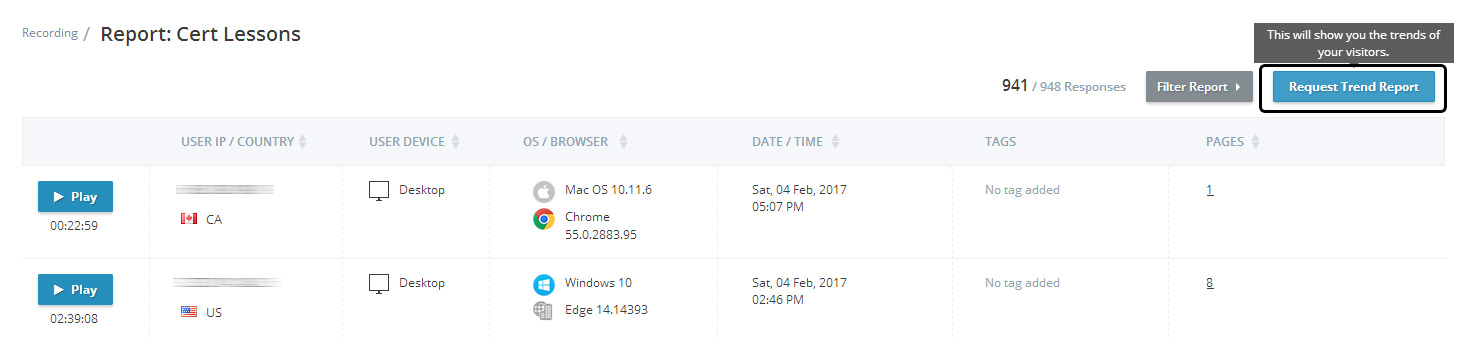
- Click this button “Request Trend Report” this will be grayed out. It take time depending upon the recordings available in campaign.

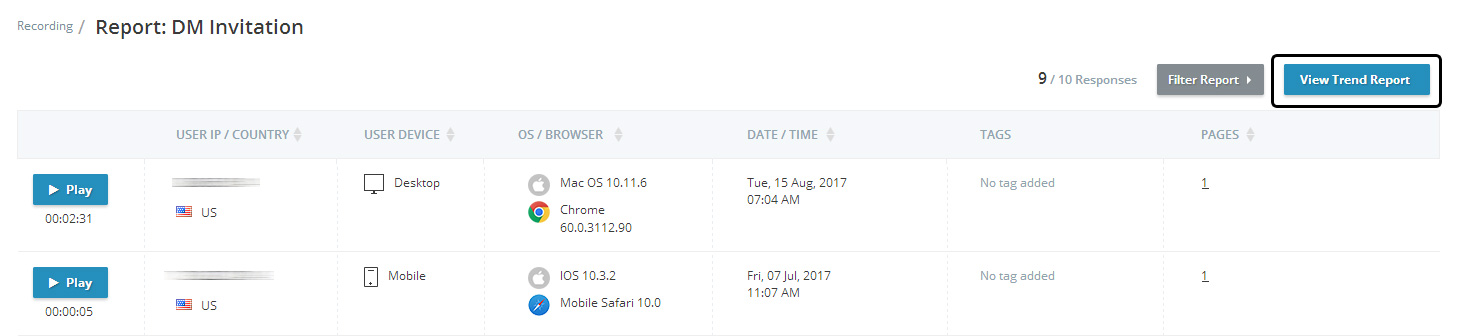
- Once the report is ready button will be enabled with “View Trend Report”.
- If this is ongoing campaign then more recording will be available. So you need to request for updated trend report from the drop down in the button.

- This updated report will replace the existing one and will available for the user.
How to Read Trend Report?
The Trend report shows the top 5 most common trend your visitor do at your website which means it saves your life for spending hours of your valuable time to see individual visitor recording. See image
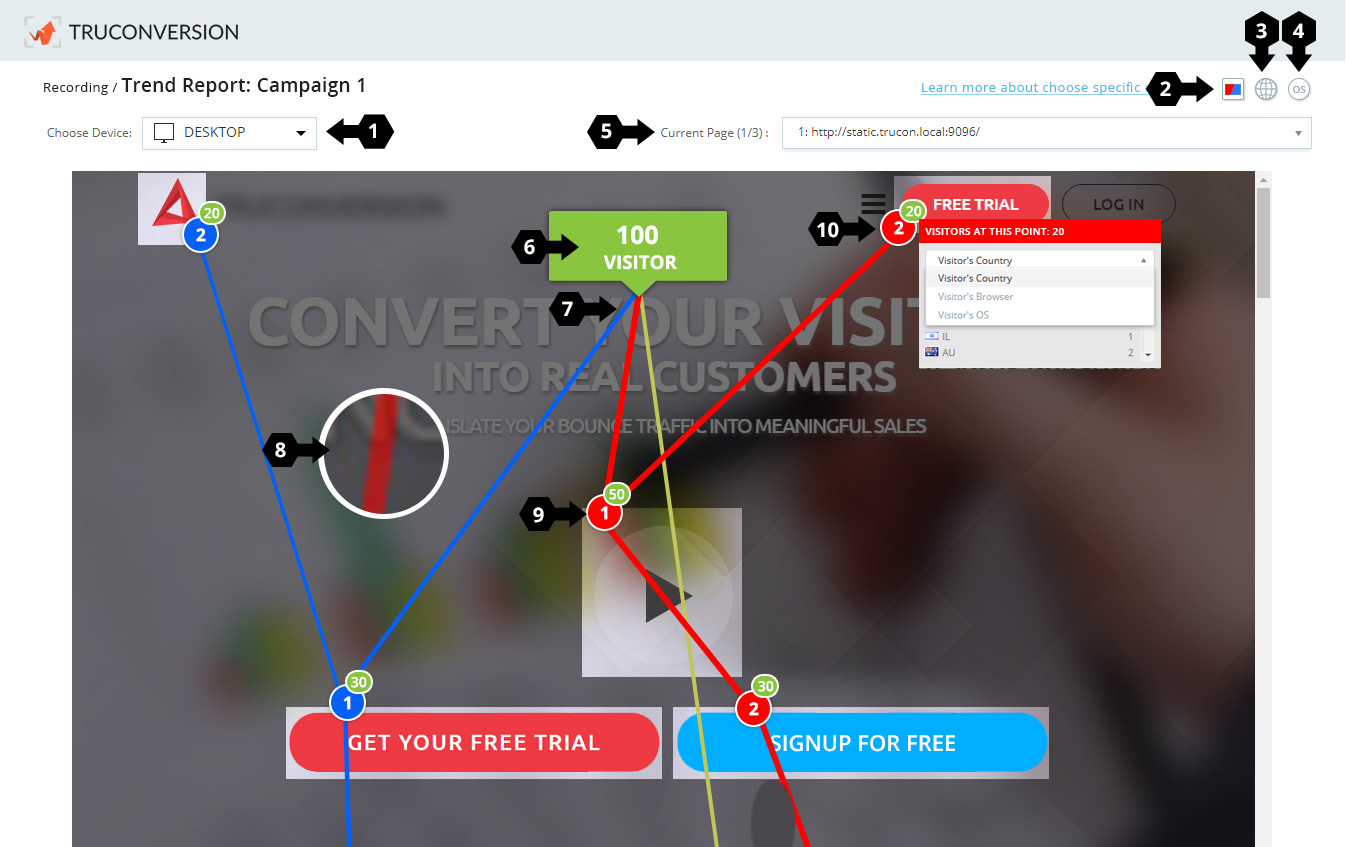
- Choose Device: Switch device from here desktop, tablet or mobile.
- Country: This will tell you about visitor country.
- Browser: Which browser used by the visitor while visiting your website.
- OS (Operating System): Which operating system visitor used while visiting your website.
- Current Page: How many pages are visited by the visitors. Select to see visitor trend on that page.
- Visitor Count: This show how many visitor arrived on this page.
- Colorful Lines: Colorful lines are representing the trends of visitor on this page.
- Lines Thickness: Each trend line has different thickness depending upon visitor count on that trend.
- Number’s/Stop over: These number’s or stop over’s means the sequence of interactions done by visitors of that particular trend during their journey.
- Details Information: By clicking on these stop overs, it will tell you that how many visitor of this particular trend reached at this point with detail information. Choose country, browser or OS.from the drop down to see details.
For example In above image, there are 3 trends Red, blue and yellow. In Red has thick trend line with most visitors 50 at first stop over in their journey, where as Blue has 30 at first stop over and Yellow will 20 visitor as it is going down the fold. In Red trend after first stop over there are two stop over 30 visitor move to “Sign up For Free” button and 20 visitor move to “Free Trial” on top left. So a trend may have multiple stop over point in their journey. See in above image.
Restrictions
- Your trend report will be limited, if your recording campaign is on login page behind or session based page.