Smart Funnel Report
Once you click on a ‘View Report’ from Funnel Dashboard this will be brought you to Funnel Report.
Smart funnel report is only available in line chart:
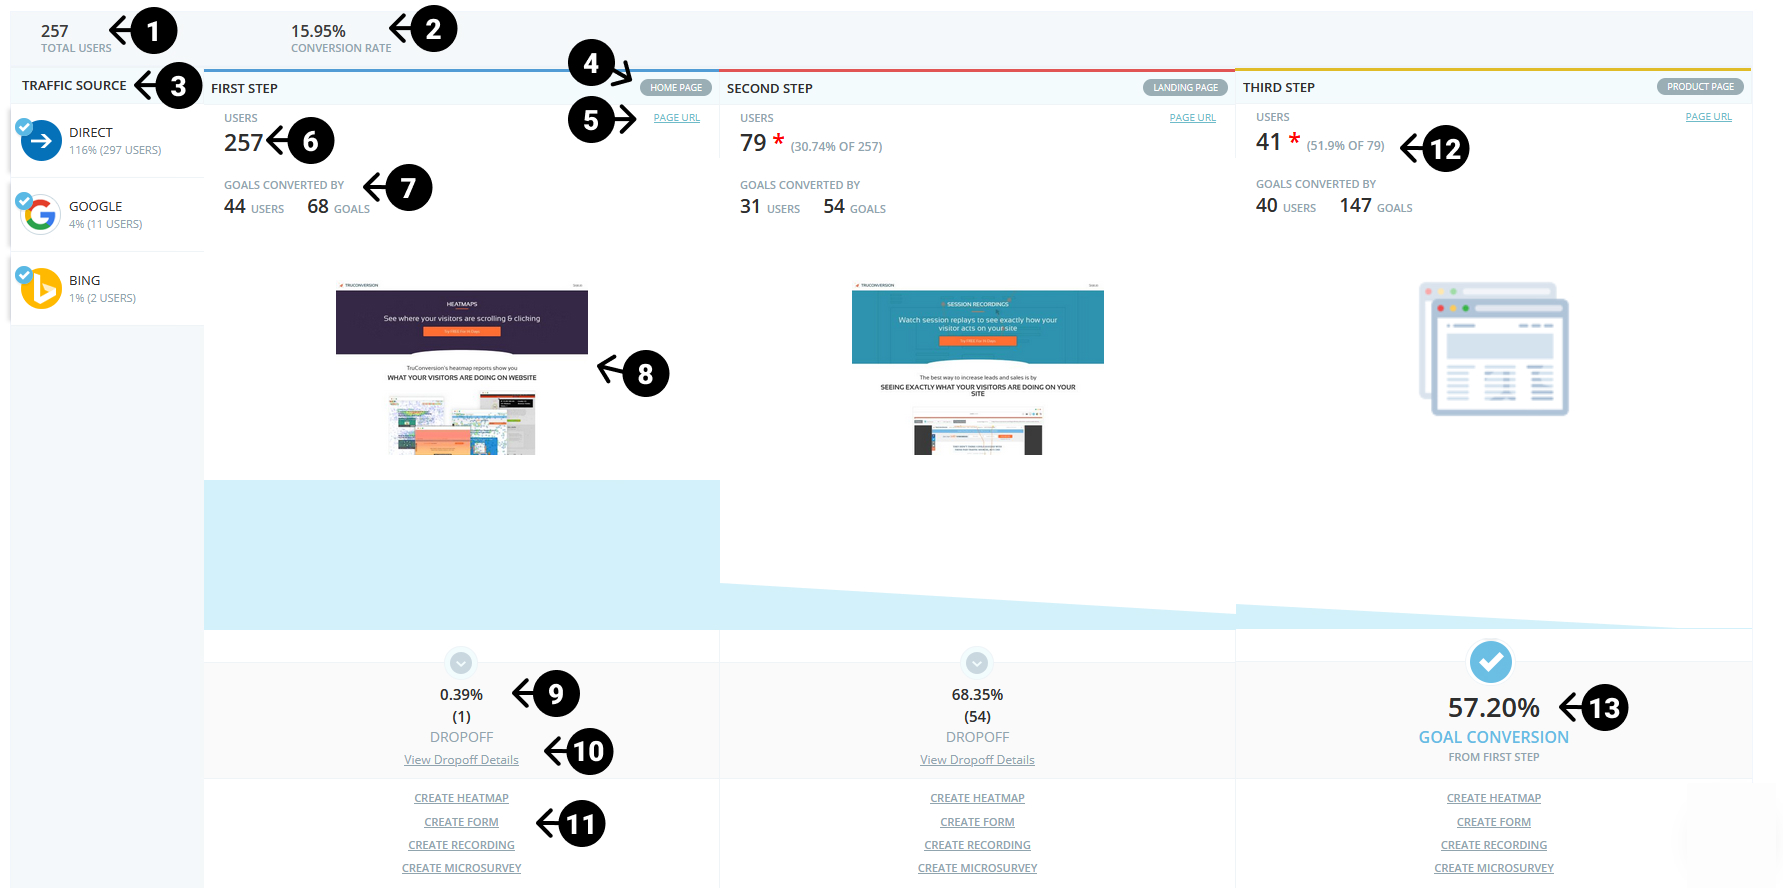
In the reports above you can view:
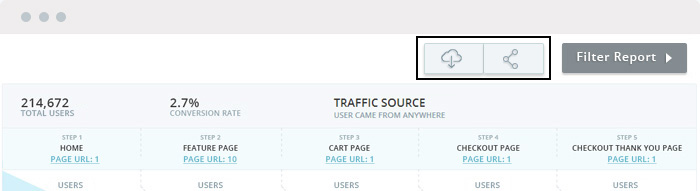
- Total Users: Number of users who started the funnel.
- Funnel Conversion Rate: Final conversion rate of the funnel((Number of people at the final step /Number of people at the first step)* 100). This conversion rate will be based on the user who pass through all the steps.
- Traffic Source: From where the people are coming in the funnel. Click and apply to exclude/include the sources.
- Page Category: Here displays the page category.
- Page URL: Click on Page URL to view how many pages are entered in each step.
- Users: Number of users arrived at this step URL.
- Goal Converted By: Number of users that completed the goals at this step URL.
- Detailed Report Page Preview: Click on page preview to see detail of each URL of step. There you can view the Goal Conversion Rate [Converted Goal/User On page*100(54/79*100=68.35%)] in comparison of Selected Percentage (The selected percentage on each goal) of each URL in step.
Important: This goal converted percentage appear on dashbard, when selected as Primary Conversion Rete from campaing configuration.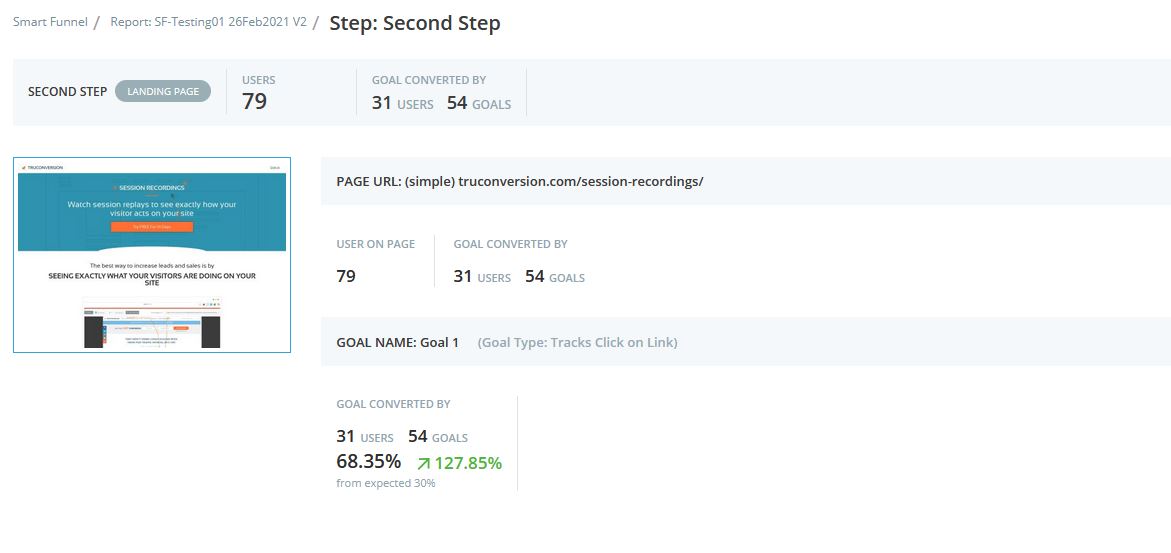
- Dropoff Percentage: Number and Percentage of people who did not move on to the desired next step in the funnel.((Number of visitors arrived at step/Number of visitor dropoff)*100).
- View Dropoff Details: By clicking this link under each Dropoff, a popup will show you the URLs where visitors have gone after leaving your funnel.
- Create Campaigns: Create other tools to see where the users are leaving with Heatmap, Recording, Microsurvey and Customer Survey.
- *Users At Next Step: Number and Percentage of the people who arrived at this step from the previous step. If the difference is identified between the number of users who converted the goals on the first step and the user arrived on this step. Then a Red Star * will appear.
This star may have the following possible reasons to appear:- There may be third-party pages. Where the goal is converted but the user does not redirect properly.
- The next step page does not load completely and the user moves to another page.
- The user has closed the browser before loading the next step.
- The user may have completed a goal more than once.
- This may be due to 15 min delay in back-end job to update these stats.
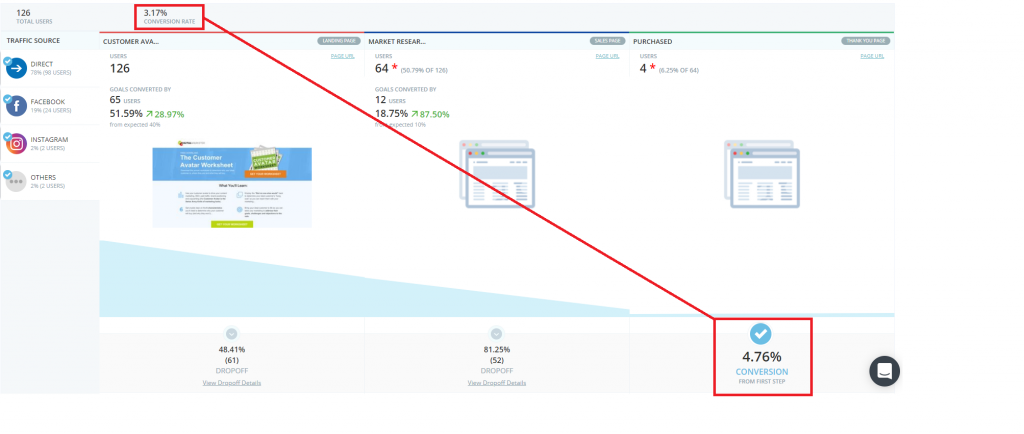
- Conversion Rate:
Funnel Conversion Rate: The Overall goal conversion rate is Total number of goal converted on last step divided by total number of users on first step. [(Total number of goals converted on last step/Total number of users on first step)*100].
Goal Conversion Rate on Last Step:Last step conversion rate is showing that X many goals are converted on the last step divided by total number of sessions on the first step [(Total goal performed on last step/total number of sessions on the first step)*100].
Note: You may found a difference between Funnel Conversion Rate and Goal Conversion Rate at last step because of multiple goals conversion on the last step.
(See image below)
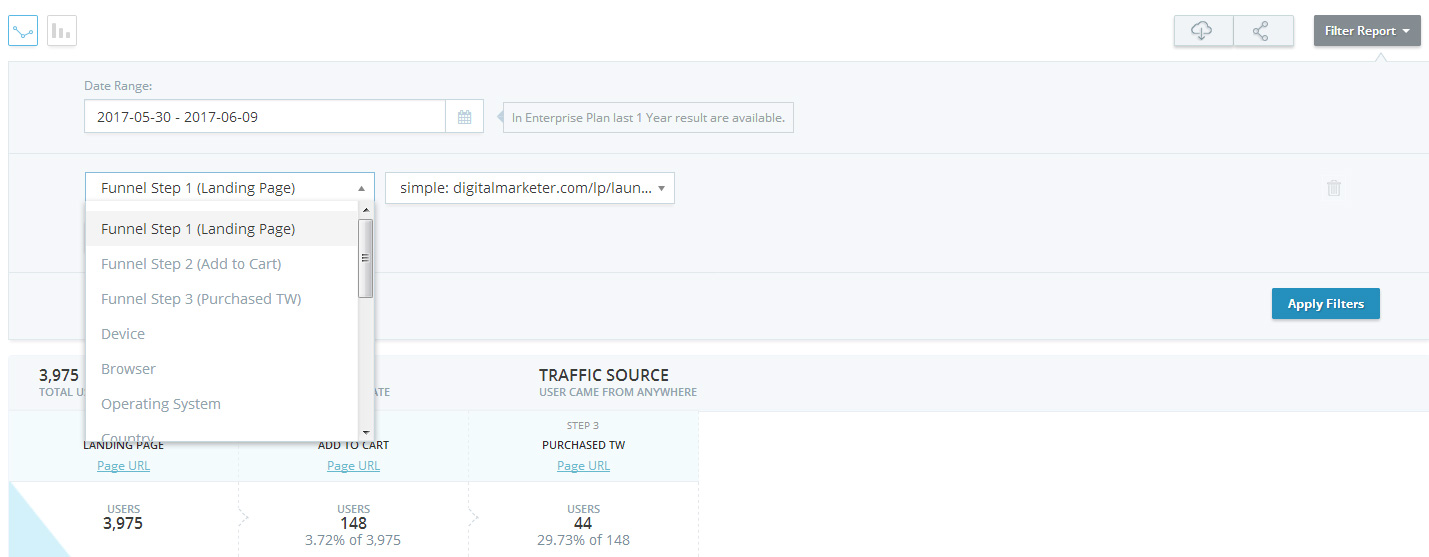
Filter Report
The report can be filtered by clicking on the Filter Report button. There are multiple filtrations presets available. Now if you have given multiple URL in each step then you can filter each step with URL. Choose steps and select URL on which you want to see the report.
Download & Share Report
- Download: By clicking download, once ready an email will be sent to the user for download CSV.
- Share Report: By clicking share report, you will be given a link which you can share with anyone.
The results can be filtered by steps URL, date range, browser, OS, country, device, screen size and keywords.